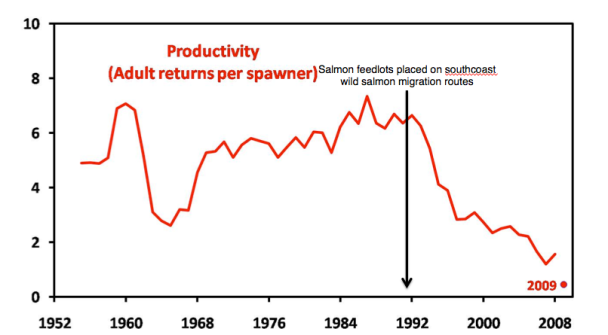
Today we are going to have fun with graphs.
This graph, according to anti-salmon farming activists, apparently explains EVERYTHING.

However, we would like to offer a few alternative explanations.
Here are some correlations which are less stupid. And of course, correlation does not equal causation, but these are backed by science and actual facts. Let’s put our critical thinking skills to work rather than believing the first graph we see.
Ecological effects of regime shifts in the Bering Sea and Eastern North Pacific Ocean
Recent Ecosystem Changes in the California Current System
Is the North Pacific Ocean Carrying Capacity for Pacific Salmon Limited?


Well said.